TRIGGERS & ALERTS
This is the third installment of a series on how I setup and use Zabbix. Here I will show how to setup triggers and alerts, so that you don’t have to constantly monitor the dashboard.
Zabbix is an open-source monitoring solution designed to monitor the performance and availability of various IT infrastructure components. It can track network devices, servers, virtual machines, databases, applications, and cloud services. Zabbix provides detailed insights into these systems, helping administrators identify and troubleshoot issues quickly before they impact operations.
Hypervisor
Virtual Machine
Server :
OS :
CPU :
RAM :
Storage :
Dell PowerEdge R720
Proxmox 8.1.4
Intel Xeon E5-2680 v2 @ 2.80GHz
256GB
7TB
OS :
CPU :
RAM :
Storage :
Ubuntu 22.04
4 cores
8GB
80GB
Creating Triggers
Zabbix triggers are logical expressions used to evaluate data collected by Zabbix and determine when a problem or anomaly occurs. Triggers analyze metrics from items (such as CPU usage, disk space, or memory) and generate alerts when predefined thresholds or conditions are met.
For example:
- A trigger can monitor if CPU usage exceeds 90% for more than 5 minutes.
- It can detect if a critical service has stopped or if free disk space falls below a certain percentage.
Triggers are a core part of Zabbix’s monitoring system, enabling automated problem detection, notifications, and actions to keep your infrastructure healthy and efficient.
I will show how I created a trigger for when CPU usage reaches 90% load.
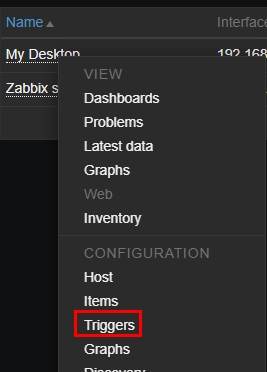
First, I clicked on a Windows host and selected ‘Triggers’.
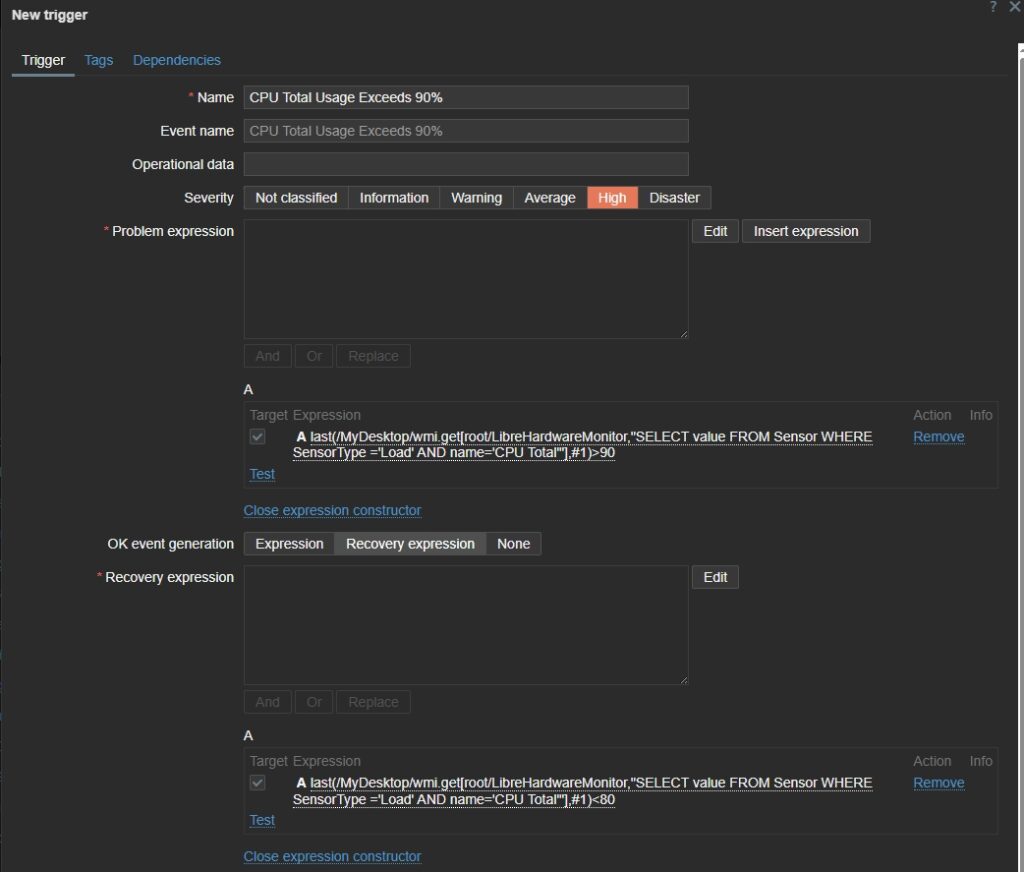
Then I created a new trigger and filled out the following to trigger when CPU usages exceeds 90%, and automatic recovers when CPU usages drops below 80%:
- Name:
CPU Total Usage Exceeds 90% - Severity: Hight.
- Problem Expression: last(/MyDesktop/wmi.get[root/LibreHardwareMonitor,”SELECT value FROM Sensor WHERE SensorType =’Load’ AND name=’CPU Total'”],#1)>90
- Recovery Expression: last(/MyDesktop/wmi.get[root/LibreHardwareMonitor,”SELECT value FROM Sensor WHERE SensorType =’Load’ AND name=’CPU Total'”],#1)<80
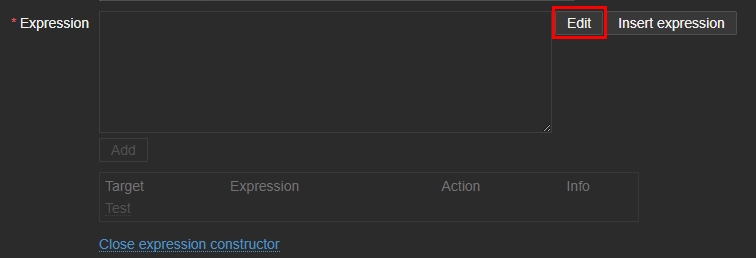
Zabbix also has a built-in ‘Expression Constructor‘.

After clicking on ‘Expression constructior‘ you’ll click on ‘Edit‘.
Then click on ‘Select‘ to choose the item you’ll want to create a trigger for.
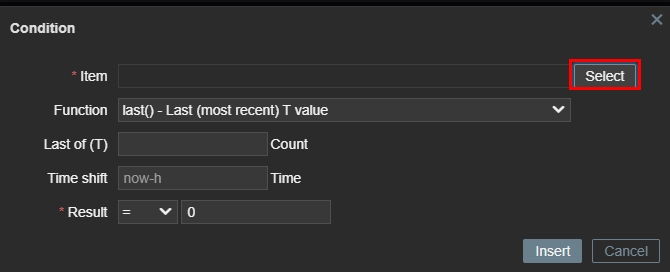
For example I can create a trigger for the GPU temperature (which isn’t included in the Zabbix agent by default, but I added the item using LibreHardwareMonitor and WMI Explorer).

Then keep the Function on the default selection. For Last of (T) can be left as blank or add a 1. Then for the Result you’ll decide if you want to get alerted when it’s greater than or greater than and equal to the temperature you decide.
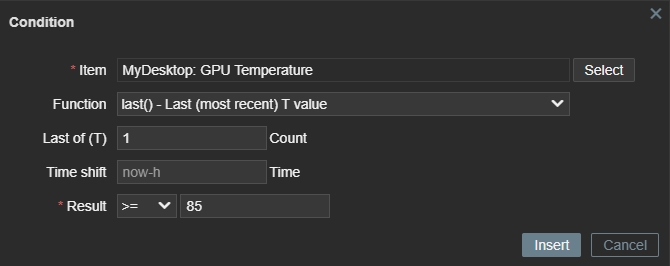
Then click Insert, and then click Add.

Creating Alerts
Zabbix Alerts are notifications sent when a trigger condition is met, allowing administrators to respond quickly to issues. Alerts are part of the action system in Zabbix, which defines how and when notifications are sent. They can be delivered through various channels such as email, SMS, Slack, Microsoft Teams, or custom scripts.
Key Features:
- Customizable Actions: Alerts can include specific messages and trigger recovery notifications.
- Escalation Support: Alerts can escalate to different users or teams based on time or severity.
- Flexible Conditions: Alerts can be tailored to activate only under specific conditions, such as business hours or critical severity.
Zabbix Alerts ensure efficient communication, helping teams maintain system uptime and address issues promptly.
I prefer receiving emails for most alerts, so I’ll show how I set that up first.
First, I went to Alerts > Media types.
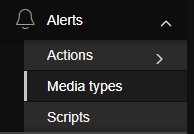
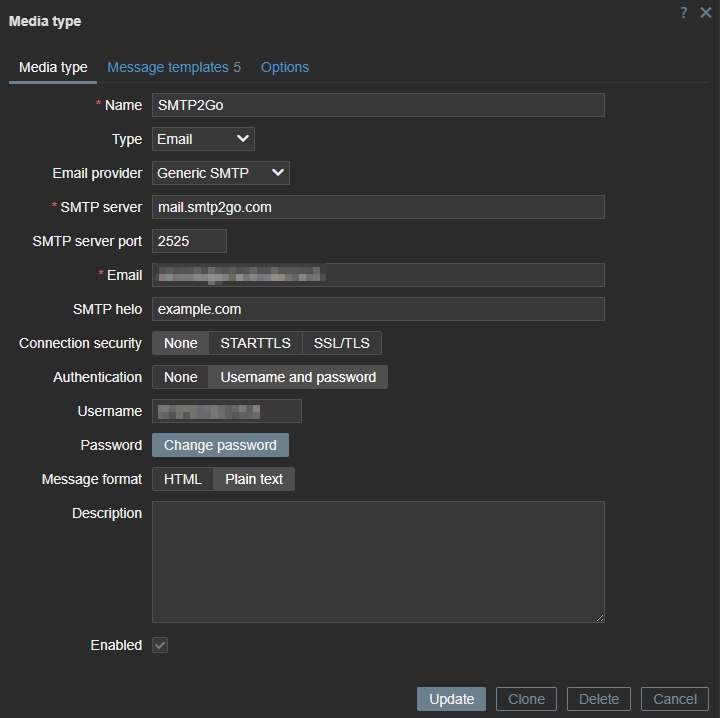
I clicked on ‘Create media type‘ and filled out the following:
- Name : I use SMTP2Go, so I named this media type after it for easy identification.
- Type : Email
- Email provider: Generic SMTP
- SMTP server: mail.smtp2go.com
- SMTP server port: 2525
- Email: <email>
- Authentication: Username and password
- Username: <username>
- Password: <password>
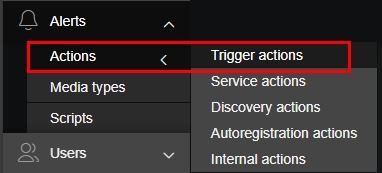
Then went to Alerts > Actions > Trigger actions.
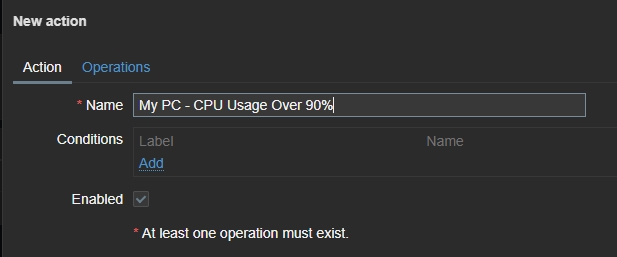
I gave the action a name. This one will be sending an email if my desktop’s CPU load goes over 90%.
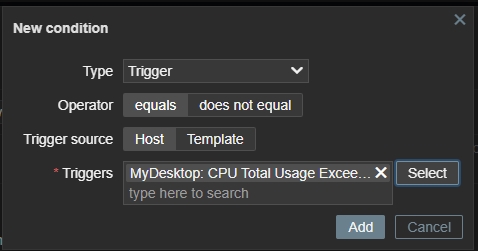
Then under ‘Conditions‘ click ‘Add‘, then next to Triggers click on ‘Select‘.

Scroll through and find the trigger.

Click ‘Add‘.
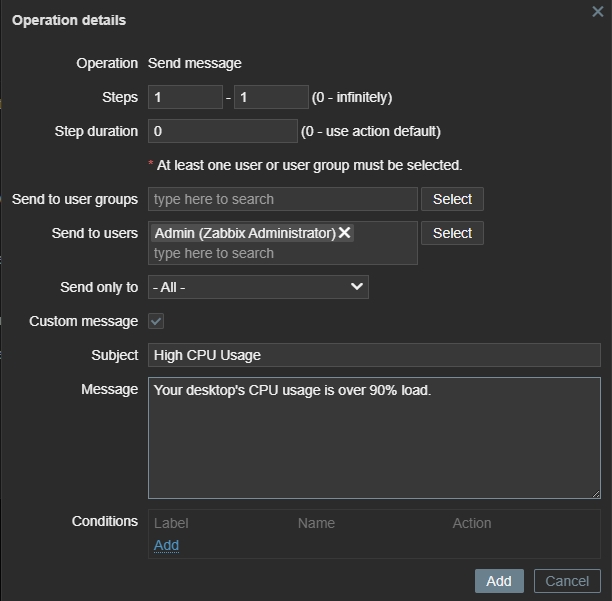
Next, clicked on the ‘Operations‘ tab, then clicked ‘Add‘ under the Operations section..
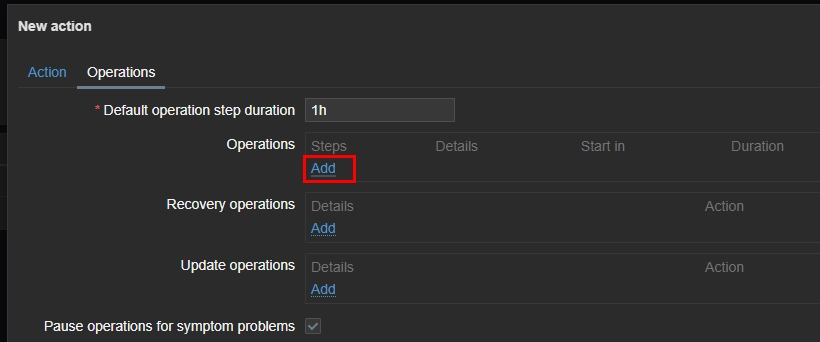
Next, clicked on the ‘Operations‘ tab, then clicked ‘Add‘ under the Operations section..
- Name : I use SMTP2Go, so I named this media type after it for easy identification.
- Type : Email
- Email provider: Generic SMTP
- SMTP server: mail.smtp2go.com
- SMTP server port: 2525
- Email: <email>
- Authentication: Username and password
- Username: <username>
- Password: <password>
