SETTING UP MONITORING
This is the second installment of a series on how I setup and use Zabbix. Here I will show common ways to setup agents to send metrics to the Zabbix server.
Zabbix is an open-source monitoring solution designed to monitor the performance and availability of various IT infrastructure components. It can track network devices, servers, virtual machines, databases, applications, and cloud services. Zabbix provides detailed insights into these systems, helping administrators identify and troubleshoot issues quickly before they impact operations.
Hypervisor
Virtual Machine
Server :
OS :
CPU :
RAM :
Storage :
Dell PowerEdge R720
Proxmox 8.1.4
Intel Xeon E5-2680 v2 @ 2.80GHz
256GB
7TB
OS :
CPU :
RAM :
Storage :
Ubuntu 22.04
4 cores
8GB
80GB
Passive Linux Agent
The Zabbix Passive Linux Agent is a component of Zabbix that listens for requests from the Zabbix server or proxy and responds with the requested system metrics. This agent operates in a server-initiated mode, making it suitable for environments where the Zabbix server can directly query the monitored Linux host.
How It Works:
- The Zabbix server sends a request to the passive agent running on the Linux host.
- The agent retrieves the requested data (e.g., CPU usage, memory utilization, disk space) and sends it back to the server.
- The server processes and stores the data for visualization and alerting.
Key Features of the Passive Agent:
- Server-Driven Monitoring: The server determines when and what data to request, offering precise control.
- Real-Time Requests: Metrics are gathered on demand, ensuring up-to-date information.
- Bidirectional Communication: The server and agent communicate directly, which can simplify configuration in certain setups.
Use Cases:
- Suitable for setups where the Zabbix server has direct network access to the Linux host.
- Ideal for real-time monitoring scenarios where the server initiates checks based on its schedule.
The passive agent is a reliable choice for centralized setups where the Zabbix server or proxy can reach monitored hosts without network constraints.
I decided to monitor the Ubuntu server with Zabbix by utilizing the Agent for Linux.
I installed the agent in the first series, now I just need to edit the configuration file.
sudo nano /etc/zabbix/zabbix_agent.conf
Server: <server IP>
Hostname: <server hostname>
					Server=10.33.99.100
Hostname=zabbix
Then restarted the Agent process.
					sudo systemctl enable zabbix-agent
sudo systemctl restart zabbix-agent
Now to configure the frontend.
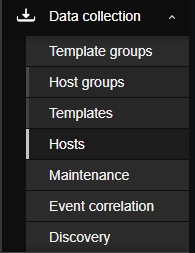
From the left-side menu I went to Data Collection > Hosts > Create Host
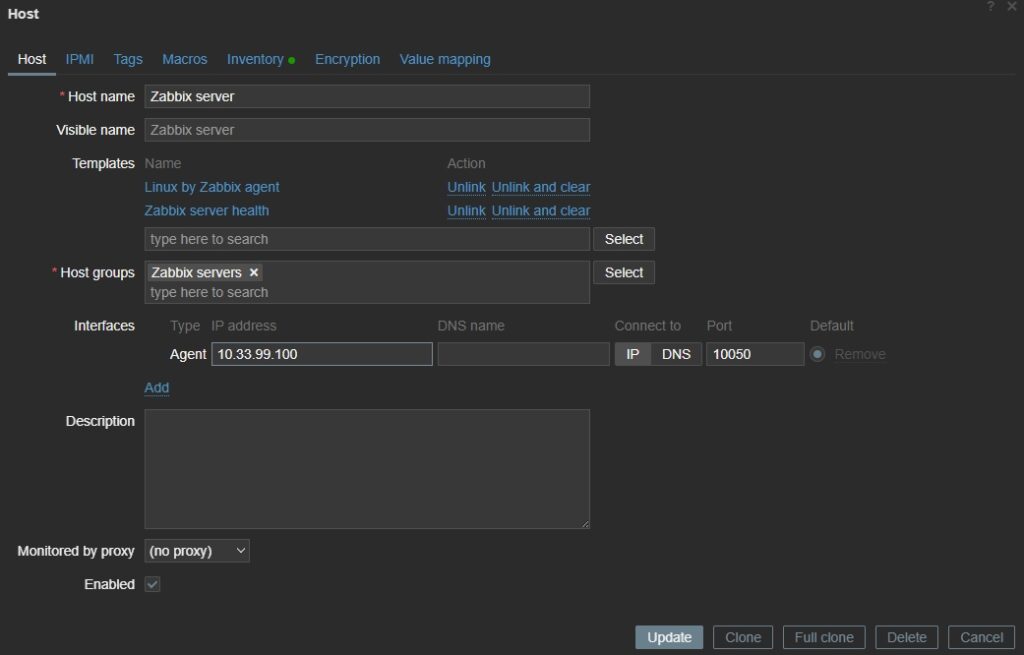
Then filled out the following:
- Host name:
Zabbix server - Visible name: automatically fills in with host name, but whatever you put here will be visible everywhere in Zabbix, instead of the host name.
- Templates:
Linux by Zabbix agent,Zabbix server health - Interfaces: I chose Agent.
- Agent IP Address:
<Zabbix server IP address>
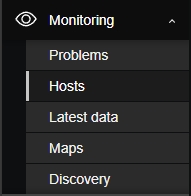
I then went to Monitoring > Hosts
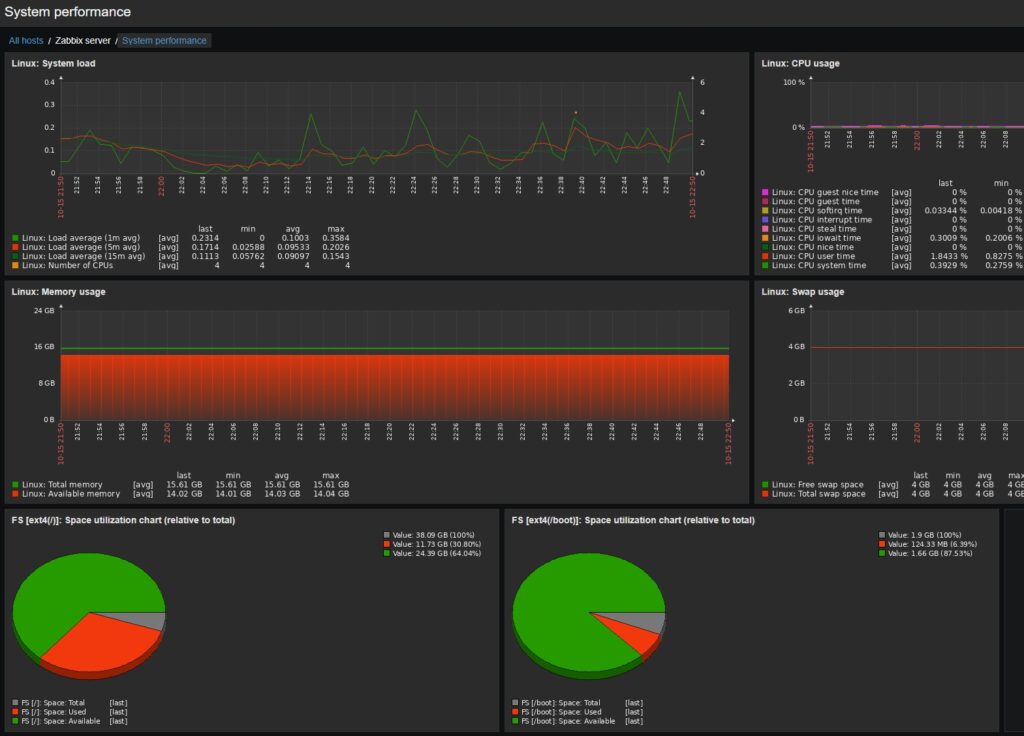
From here I can see latest data, graphs, and premade dashboards.
Active Linux Agent
The Zabbix Active Linux Agent is a component of Zabbix that actively collects and sends system metrics from a Linux host to the Zabbix server or proxy. Unlike passive agents, which respond to requests from the server, the active agent operates autonomously by sending pre-configured metrics at regular intervals.
How It Works:
- The Zabbix agent reads a list of monitoring items (e.g., CPU usage, disk space, running processes) from the Zabbix server or proxy.
- The agent collects these metrics on the host.
- It actively pushes the collected data back to the Zabbix server or proxy for processing and visualization.
Benefits of the Active Agent:
- Reduced Load on the Server: Since the agent initiates communication, it reduces the server’s workload and eliminates the need for constant polling.
- Firewall-Friendly: Active checks require only outbound communication from the host, making them easier to set up in environments with strict firewall rules.
- Reliable in Distributed Setups: Ideal for hosts in remote locations or behind NAT, where the server cannot initiate a connection.
The active agent is a great choice for environments where efficient and autonomous data collection is essential, particularly in distributed or secure setups.
I SSH’d into another Ubuntu server I have (this one was for Netbox) and installed the agent like I did previously.
Then I edited the configuration file.
sudo nano /etc/zabbix/zabbix_agent.conf
Then I changed the following lines:
- ServerActive :
<Zabbix server's IP address> - Hostname : The host name of the server you’re making an active agent.
					ServerActive=10.33.99.100
Hostname:netbox
Then restarted the service.
sudo systemctl restart zabbix-agent
Then I created a new host and filled out the following:
- Host name:
netbox - Visible name:
Netbox Server - Templates:
Linux by Zabbix agent active - Interfaces: I chose Agent.
- Agent IP Address:
<Netbox's server IP address>
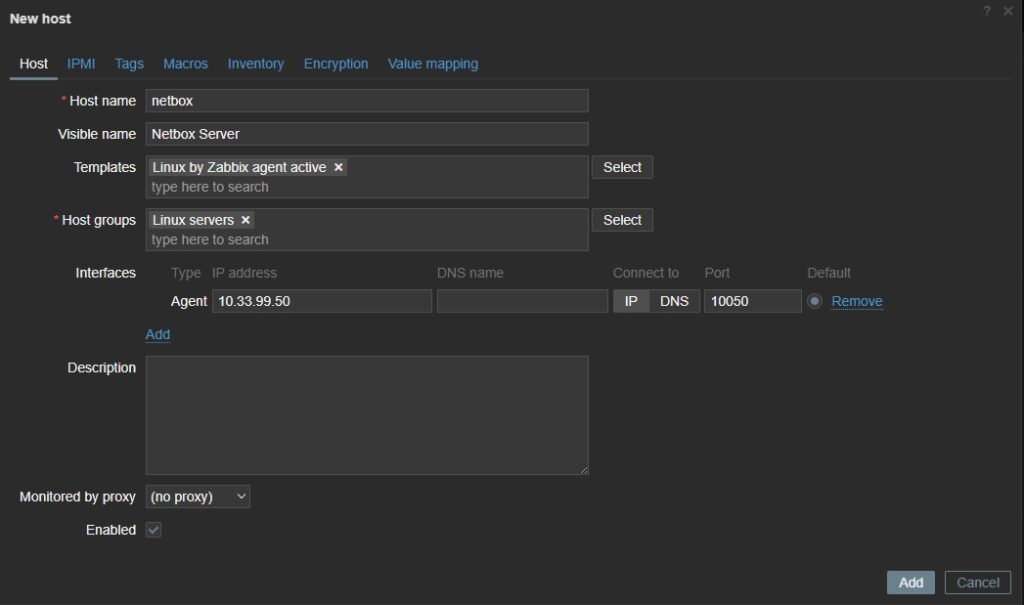
Like before, you can go to Monitoring > Hosts to view the data.
SNMP on Linux
SNMP (Simple Network Management Protocol) is a standard protocol used to monitor and manage devices in a network. On Linux systems, SNMP can be configured to provide detailed system and application metrics, such as CPU usage, memory utilization, disk space, network traffic, and process monitoring. This data can be queried by monitoring tools like Zabbix.
Key Components of SNMP on Linux:
- SNMP Agent: A daemon (e.g.,
snmpd) runs on the Linux system and responds to SNMP queries from monitoring tools. - MIB (Management Information Base): A hierarchical database of objects that define what can be monitored or managed on the system.
- SNMP Versions: Supports SNMPv1, SNMPv2c, and SNMPv3, with SNMPv3 offering enhanced security through authentication and encryption.
How it Works with Zabbix:
- Zabbix sends SNMP requests to the Linux system’s SNMP agent.
- The agent retrieves the requested data and sends it back to Zabbix.
- Zabbix displays the data for monitoring and alerting.
SNMP is ideal for agentless monitoring or when a Linux system needs to provide data to multiple monitoring tools using an industry-standard protocol.
I SSH’d into another Ubuntu server I have (this one was for Grafana).
First, I installed SNMP.
sudo apt install snmp snmpd libsnmp-dev
Then I created an SNMPv3 user.
sudo net-snmp-create-v3-user -ro -a my_authpass -x my_privpass -A SHA -X AES snmpv3user
my_authpass: The authorization passwordmy_privpass: The privacy passwordsnmpv3user: The user name.
Then I edited the SNMP configuration file to allow Zabbix to read all SNMP objects.
sudo nano /etc/snmp/snmpd.conf
I added the following under the View Systemview lines:
view systemview included .1
Then started and enabled the snmpd daemon.
					sudo systemctl enable snmpd
sudo systemctl start snmpd
Then I created a new host and filled out the following:
- Host name:
netbox - Visible name:
Netbox Server - Templates:
Linux by Zabbix agent active - Interfaces: I chose Agent.
- Agent IP Address:
<Netbox's server IP address>
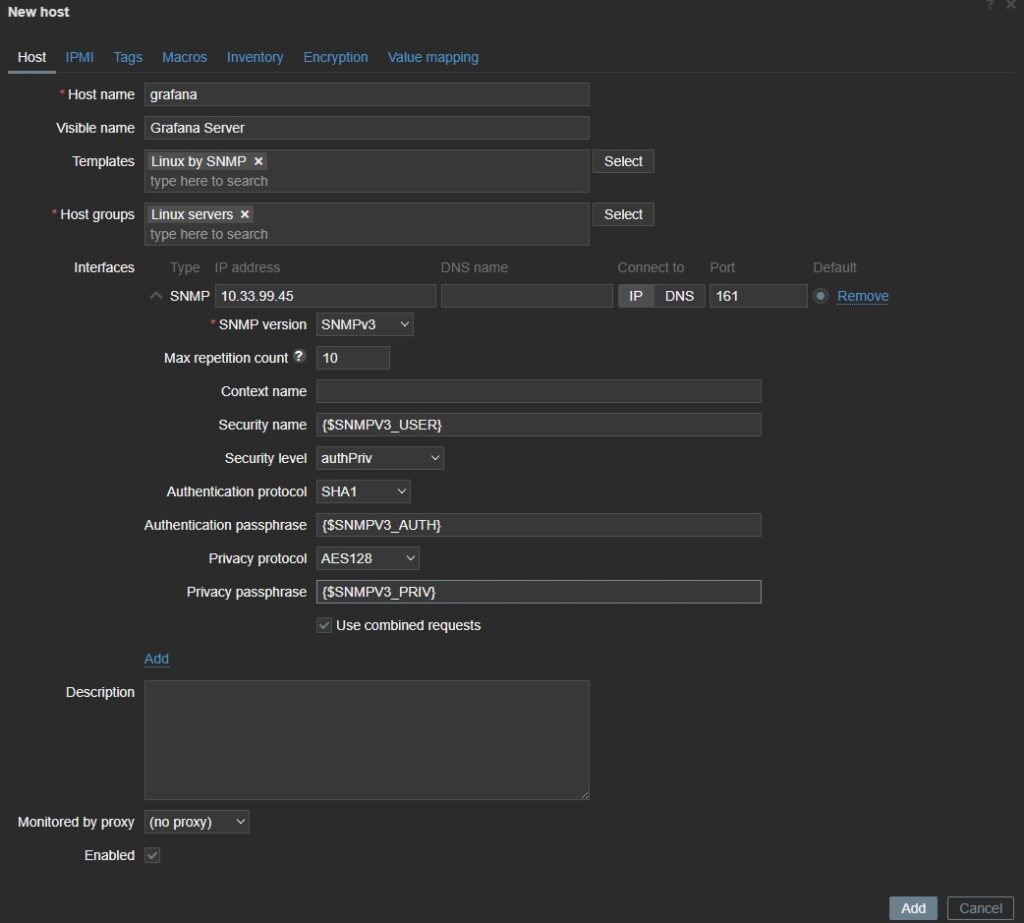
Then clicked on the Macros tab and filled out the following:
- Host name:
netbox - Visible name:
Netbox Server - Templates:
Linux by Zabbix agent active - Interfaces: I chose Agent.
- Agent IP Address:
<Netbox's server IP address>
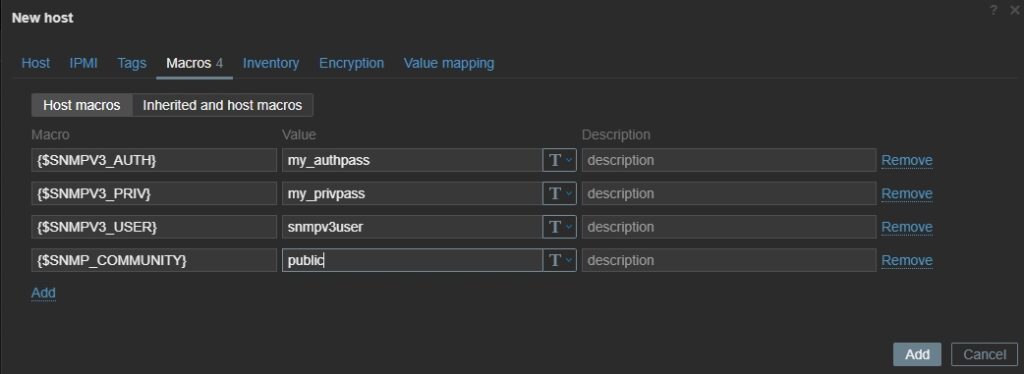
Like before, you can go to Monitoring > Hosts to view the data.
Simple Checks
Zabbix Simple Checks are lightweight, predefined monitoring methods built into Zabbix that allow you to gather specific system metrics without requiring an agent. These checks use standard network protocols and services (like ICMP or TCP) to monitor key performance indicators for hosts.
Example of Simple Checks:
- ICMP ping: Checks if a host is reachable on the network.
- TCP status: Verifies if a specific port on a host is open or closed.
- HTTP response time: Measures the response time of a web server.
Simple Checks are ideal for basic, quick monitoring tasks where agent installation is unnecessary or impractical. They are configured directly in Zabbix as items and require minimal setup, making them a useful tool for monitoring availability and connectivity.
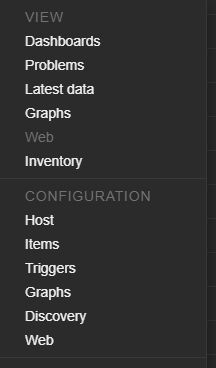
First, I go to Monitoring > Hosts
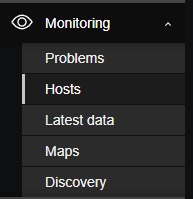
Then I clicked on a host I want to create a simple check for and select Items.
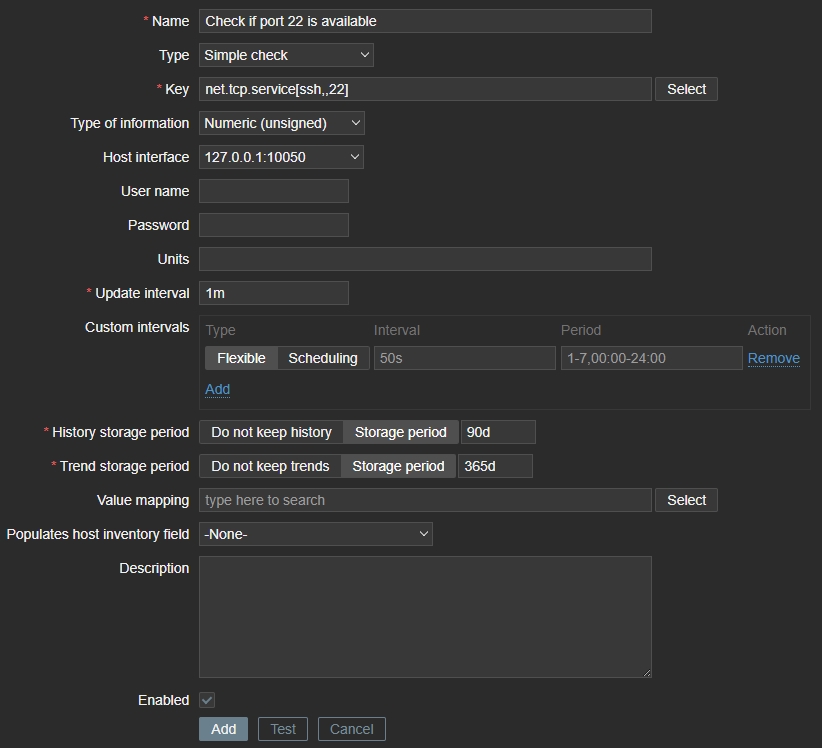
Then I filled out the following:
- Name: This one will be checking if port 22 is available.
- Type: Simple Check
- Key: You can click on ‘Select‘ and it will give you templates, and you just have to replace the values.
- Type of information: Numeric
I then clicked on the Tag tab.
Adding a tag to the item is helpful since it will help filter and find our item in several places.

Now when I go back to that host and click on ‘Latest Data‘ it should show that value I just created.
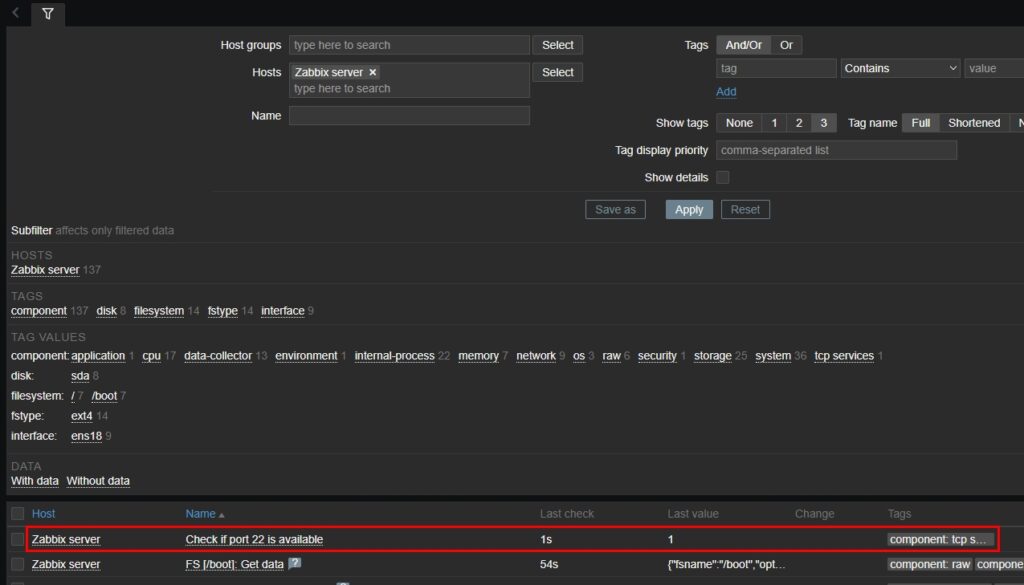
Right now it displays the last value as ‘1‘. I can change this creating a value mapping.
I clicked on the server and selected ‘Host‘ and then went to the ‘Value Mapping‘ tab.
I then added the following mappings. Then clicked Add, then Update.
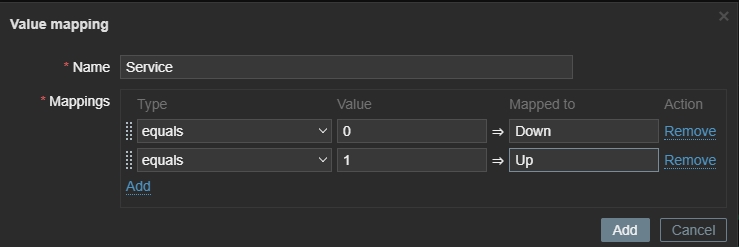
Then I went back to edit the item I created.
I clicked on ‘Select‘ and added the ‘Service‘ mapping I created. Then clicked Update.
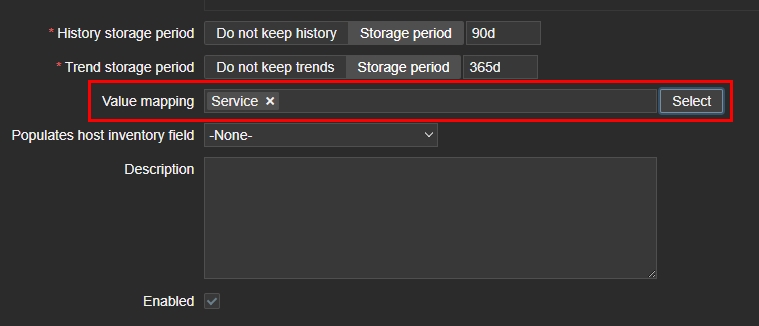
Now when I look at the latest data it will show “Up (1)” instead of just ‘1‘.

Windows Agent
The Windows Zabbix Agent is a lightweight application installed on Windows systems to collect system metrics and send them to a Zabbix server for monitoring. It acts as a bridge between the Windows operating system and Zabbix, enabling agent-based monitoring of a wide range of data points, such as CPU usage, memory utilization, disk space, network traffic, and hardware metrics.
The agent works by:
- Collecting data from the Windows system using built-in tools, such as WMI (Windows Management Instrumentation), or by executing custom commands.
- Sending the collected metrics to the Zabbix server or proxy for processing and visualization.
Key Features:
- Low system resource usage.
- Easy to configure via a text-based configuration file.
- Support for advanced data collection methods, like WMI queries.
Using the Windows Zabbix Agent allows for seamless, detailed monitoring of Windows systems, making it an essential component for organizations relying on Zabbix for IT infrastructure management.
First I downloaded the 6.4 agent from: Download Zabbix agents

Then launched the installer and clicked Next.
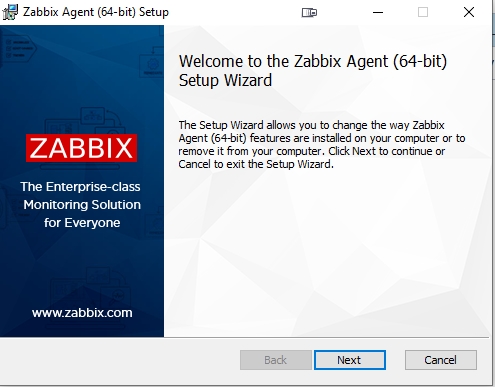
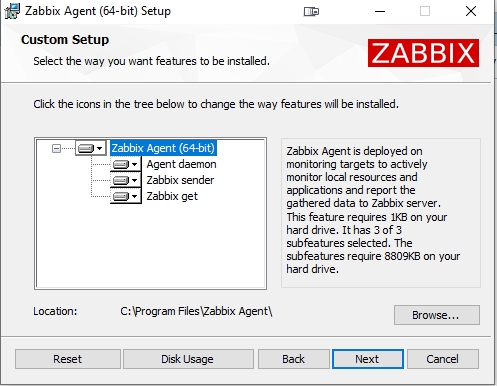
Left the defaults and clicked Next.
Then filled out the following:
- Host name: Host name of computer
- Zabbix server IP/DNS: IP of the Zabbix server
- Agent listen port: I left the default port
- Server or Proxy for active checks: IP for Zabbix server
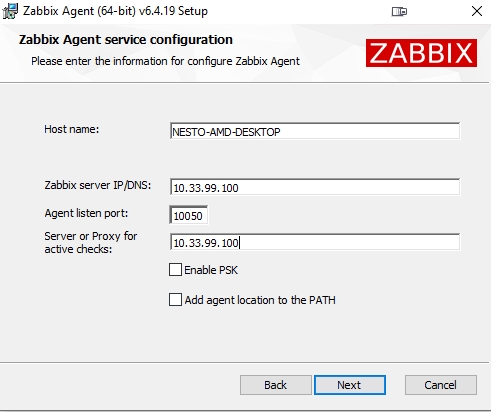
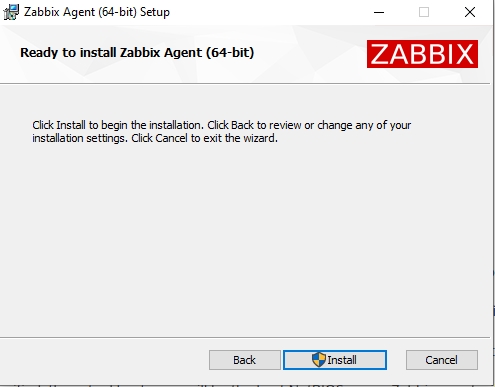
Finally, installed.
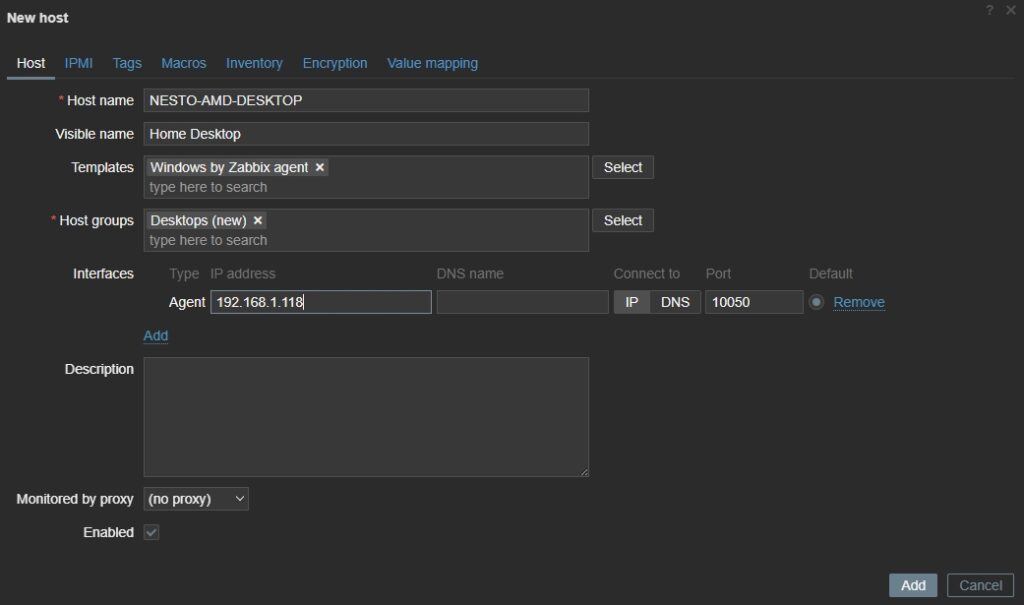
Then I created a new host and filled out the following:
- Host name:
<desktop name> - Visible name: Home Desktop
- Templates:
Windows by Zabbix agent - Interfaces: I chose Agent.
- Agent IP Address:
<internal IP of my desktop>
WMI Query
WMI (Windows Management Instrumentation) is a core component of Windows that provides a standardized way to access detailed system and hardware information. A WMI query is a specific command used to request this information from the system, targeting data like CPU usage, temperature, disk space, fan speed, or network statistics.
In the context of Zabbix, a WMI query is used by the Windows Zabbix Agent to retrieve this data and send it to the Zabbix server for monitoring. By defining items in Zabbix that use WMI queries, you can monitor a wide range of system metrics directly from a Windows machine.
For example:
- Namespace: The area in WMI where the data resides (e.g.,
root/LibreHardwareMonitor). - Query: Specifies the information to retrieve (e.g.,
"SELECT value FROM Sensor WHERE SensorType='Temperature' AND name='CPU Package'").
Using WMI queries with the Windows Zabbix Agent allows for agent-based monitoring of hardware metrics without needing external tools or scripts.
First, download LibreHardwareMonitor on the Windows host.
Releases · LibreHardwareMonitor/LibreHardwareMonitor
After extracting the zipped file, I ran the installation as administrator.
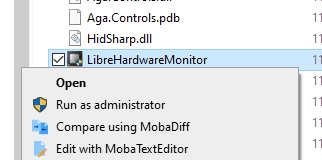
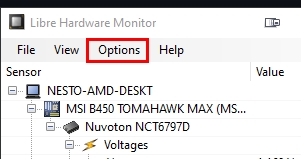
The program will start automatically, so next click on Options and make sure to select ‘Run On Windows Startup‘.
Then I downloaded WMI Explorer:
Releases · vinaypamnani/wmie2
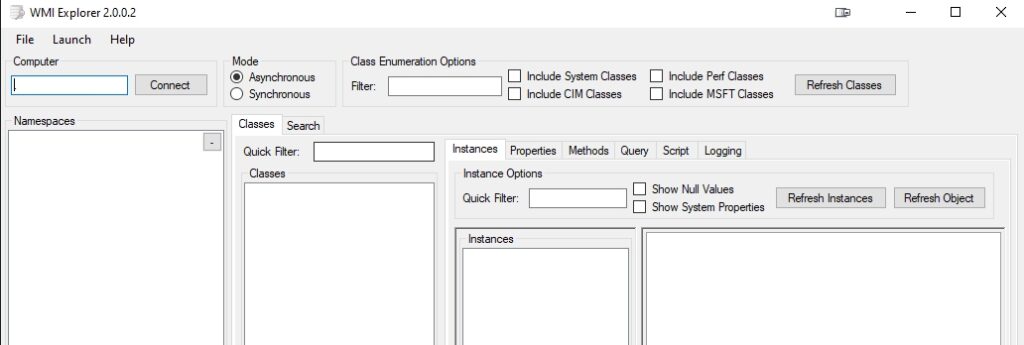
Extracted the file and ran the exe.
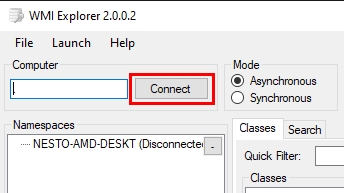
Clicked on ‘Connect‘.
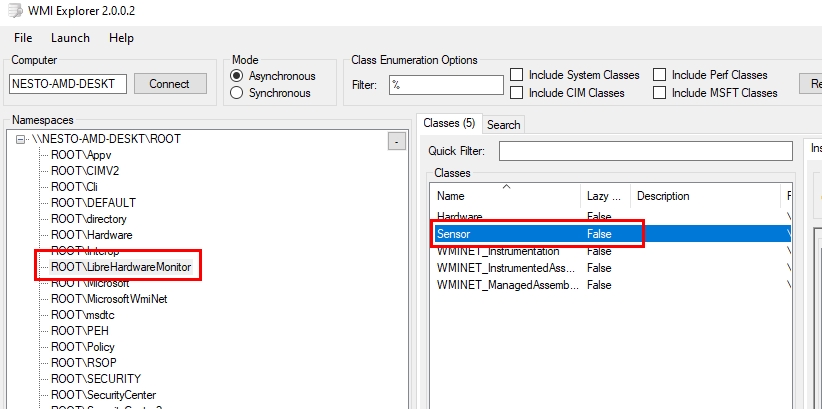
Double clicked on ‘ROOT\LibreHardwareMonitor‘, then double clicked on ‘Sensor‘.
Then scrolled through the sensors for each one I’d like to monitor, making note of the SensorType and Name.
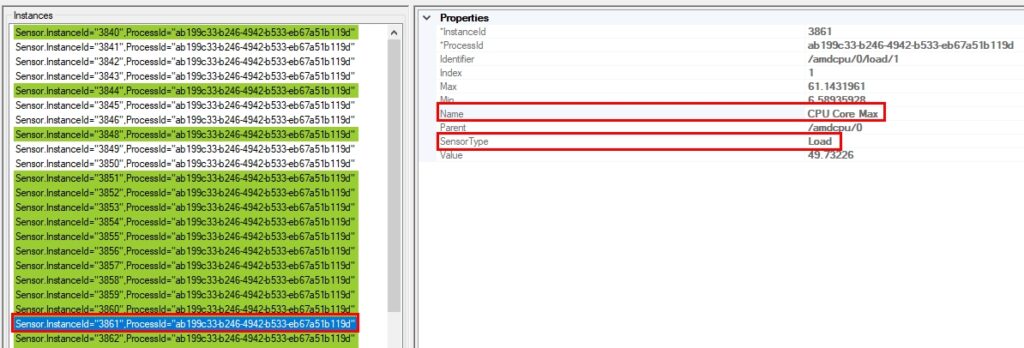
The Key template will be the following:
wmi.get[root/LibreHardwareMonitor,"SELECT value FROM Sensor WHERE SensorType ='sensortype' AND name='name'"]
Example:
wmi.get[root/LibreHardwareMonitor,"SELECT value FROM Sensor WHERE SensorType ='Load' AND name='CPU Core Max'"]
Next, went back to Zabbix > Monitoring > Hosts and clicked on the Windows host and clicked ‘Items‘.
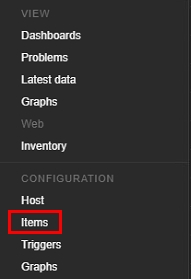
I then clicked ‘Create Item‘ and filled out the following:
- Name: Descriptive name
- Type: Zabbix agent
- Key: Pasted the key
- Type of information: Numeric (float)
- Host interface: IP address of host
- Unit: This will change depending on the sensor.
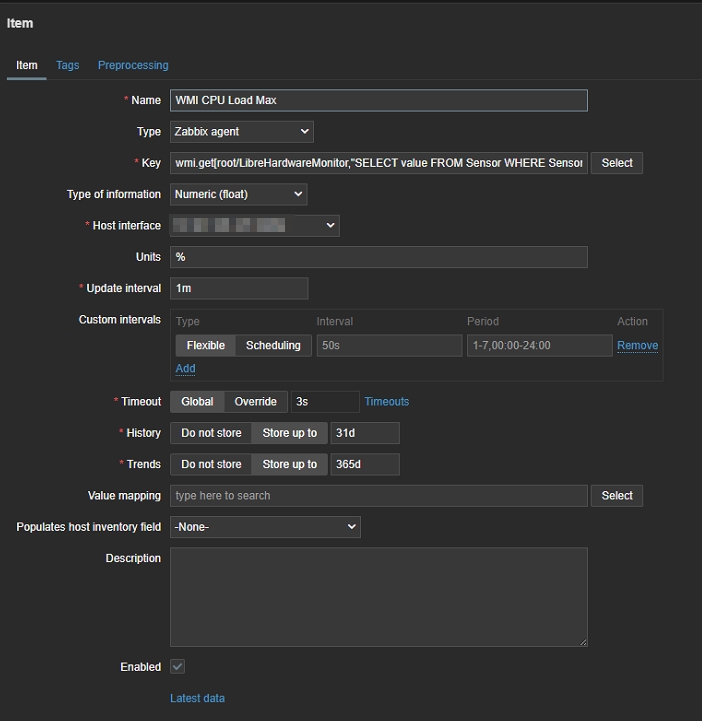
More examples from my computer:
					wmi.get[root/LibreHardwareMonitor,"SELECT value FROM Sensor WHERE SensorType ='Control' AND name='Fan #1'"]
wmi.get[root/LibreHardwareMonitor,"SELECT value FROM Sensor WHERE SensorType ='Load' AND name='CPU Core #1'"]
wmi.get[root/LibreHardwareMonitor,"SELECT value FROM Sensor WHERE SensorType ='Load' AND name='CPU Total'"]
wmi.get[root/LibreHardwareMonitor,"SELECT value FROM Sensor WHERE SensorType ='Load' AND name='CPU Core Max'"]
wmi.get[root/LibreHardwareMonitor,"SELECT value FROM Sensor WHERE SensorType ='Power' AND name='Package'"]
wmi.get[root/LibreHardwareMonitor,"SELECT value FROM Sensor WHERE SensorType ='Clock' AND name='Core #1'"]
wmi.get[root/LibreHardwareMonitor,"SELECT value FROM Sensor WHERE SensorType ='Factor' AND name='Core #1'"]
wmi.get[root/LibreHardwareMonitor,"SELECT value FROM Sensor WHERE SensorType ='Power' AND name='Core #1 (SMU)'"]
wmi.get[root/LibreHardwareMonitor,"SELECT value FROM Sensor WHERE SensorType ='Voltage' AND name='Core #1 VID'"]
wmi.get[root/LibreHardwareMonitor,"SELECT value FROM Sensor WHERE SensorType ='Temperature' AND name='Core (Tctl/Tdie)'"]
wmi.get[root/LibreHardwareMonitor,"SELECT value FROM Sensor WHERE SensorType ='Temperature' AND name='CCD1 (Tdie)'"]
wmi.get[root/LibreHardwareMonitor,"SELECT value FROM Sensor WHERE SensorType ='Voltage' AND name='Core (SVI2 TFN)'"]
wmi.get[root/LibreHardwareMonitor,"SELECT value FROM Sensor WHERE SensorType ='Voltage' AND name='SoC (SVI2 TFN)'"]
wmi.get[root/LibreHardwareMonitor,"SELECT value FROM Sensor WHERE SensorType ='Clock' AND name='Bus Speed'"]
wmi.get[root/LibreHardwareMonitor,"SELECT value FROM Sensor WHERE SensorType ='Temperature' AND name='GPU Core'"]
wmi.get[root/LibreHardwareMonitor,"SELECT value FROM Sensor WHERE SensorType ='Clock' AND name='GPU Core'"]
wmi.get[root/LibreHardwareMonitor,"SELECT value FROM Sensor WHERE SensorType ='Clock' AND name='GPU Memory'"]
wmi.get[root/LibreHardwareMonitor,"SELECT value FROM Sensor WHERE SensorType ='Fan' AND name='GPU Fan'"]
wmi.get[root/LibreHardwareMonitor,"SELECT value FROM Sensor WHERE SensorType ='Control' AND name='GPU Fan'"]
wmi.get[root/LibreHardwareMonitor,"SELECT value FROM Sensor WHERE SensorType ='Load' AND name='GPU Core'"]
wmi.get[root/LibreHardwareMonitor,"SELECT value FROM Sensor WHERE SensorType ='Load' AND name='GPU Memory Controller'"]
wmi.get[root/LibreHardwareMonitor,"SELECT value FROM Sensor WHERE SensorType ='Load' AND name='GPU Video Engine'"]
wmi.get[root/LibreHardwareMonitor,"SELECT value FROM Sensor WHERE SensorType ='Load' AND name='GPU Bus'"]
wmi.get[root/LibreHardwareMonitor,"SELECT value FROM Sensor WHERE SensorType ='Load' AND name='GPU Power'"]
