Table of Contents
Here I will show how I setup Grafana, for visualization, with Prometheus for metrics. I used the same Grafana server I setup for InfluxDB. I use Prometheus to monitor my desktop, and laptops.
Screenshots
-
Grafana LXC Configuration
Installing Ubuntu Container
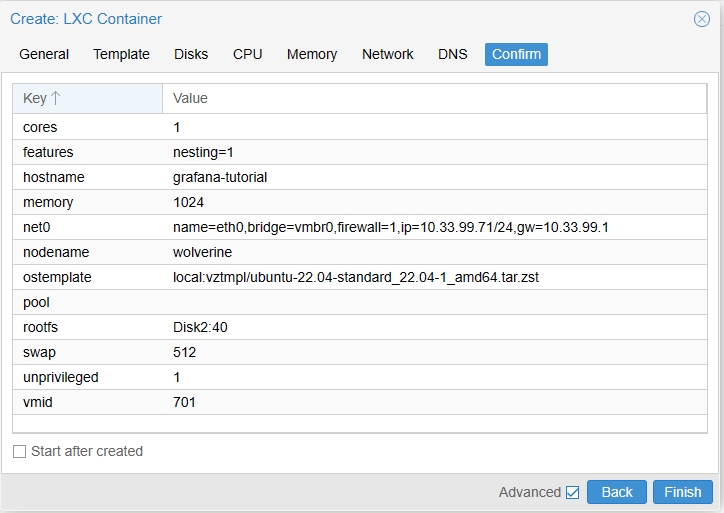
01. This container will be used to host Grafana, Promtail, and Loki.
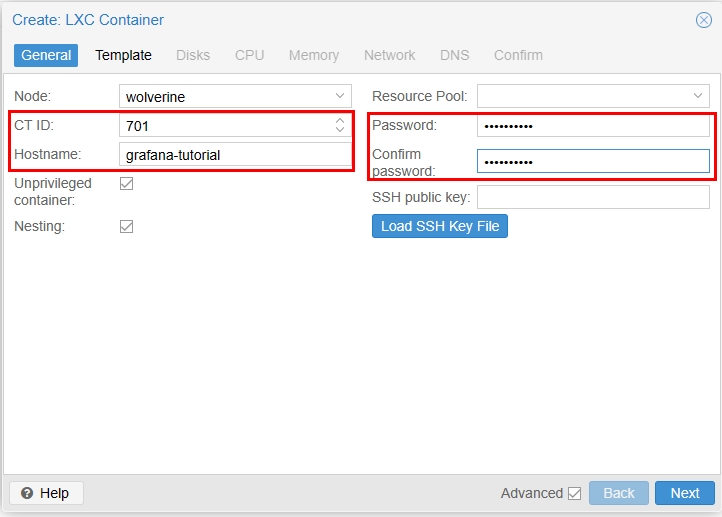
02. I used the Ubuntu 22.04 template.
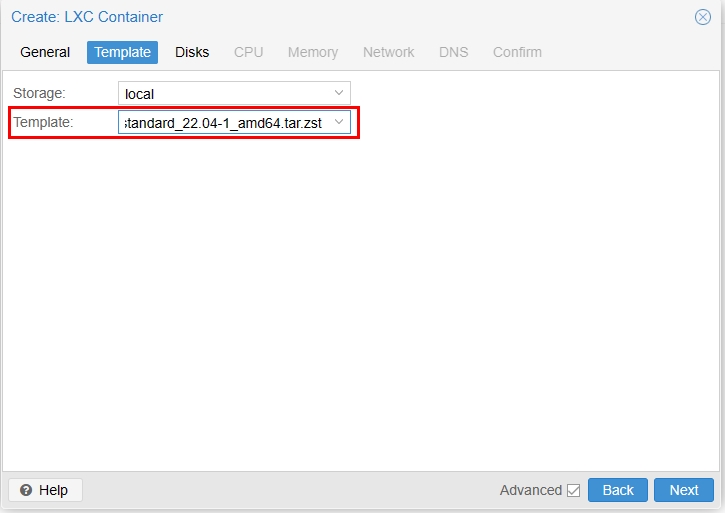
03. I increased the size to 40GB just because I have enough storage.
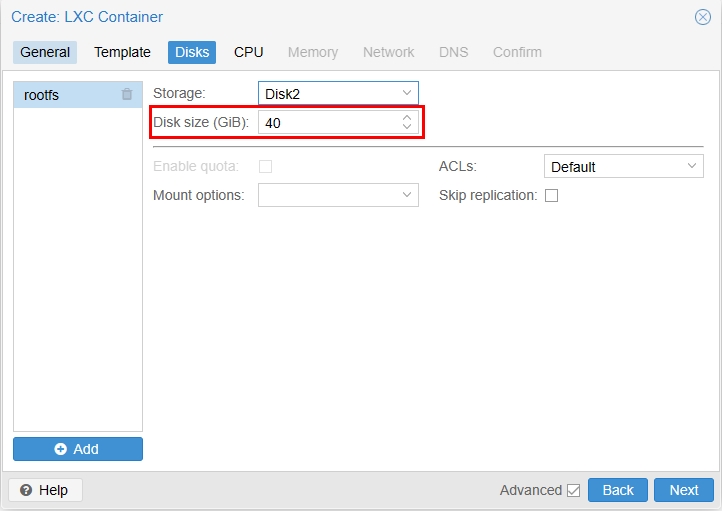
04. I left it at 1 core, which is more than enough. It currently idles at .27% CPU usage.
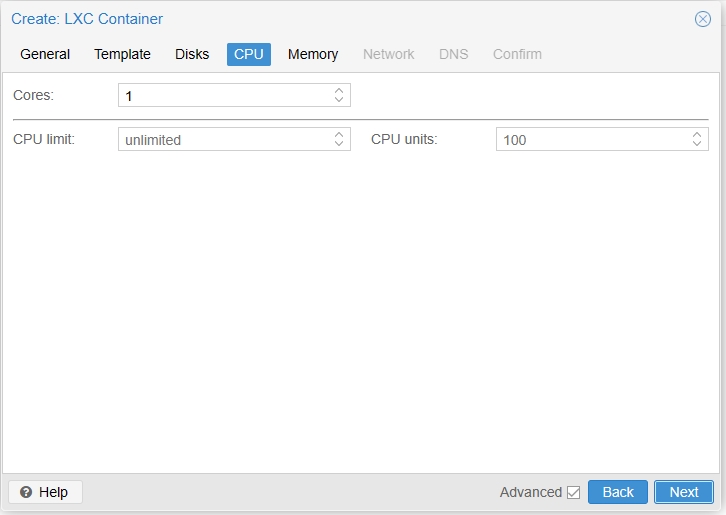
05. I increased the RAM to 1GB, which has been enough since it idles around 55% usage.
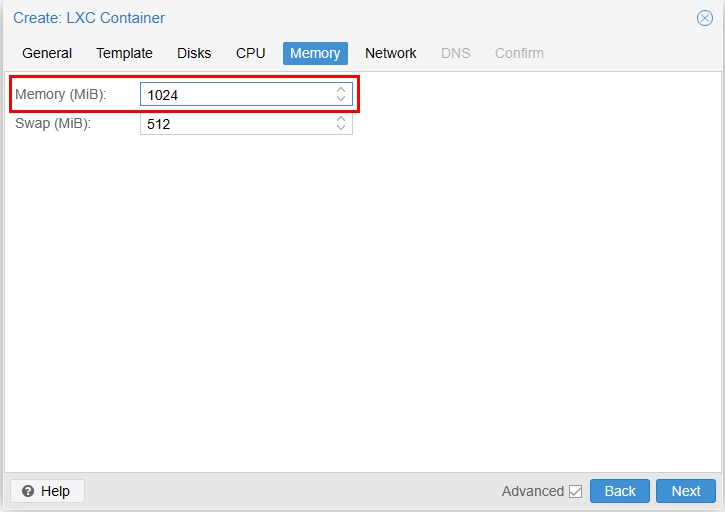
06. I gave it IP's within my subnet.
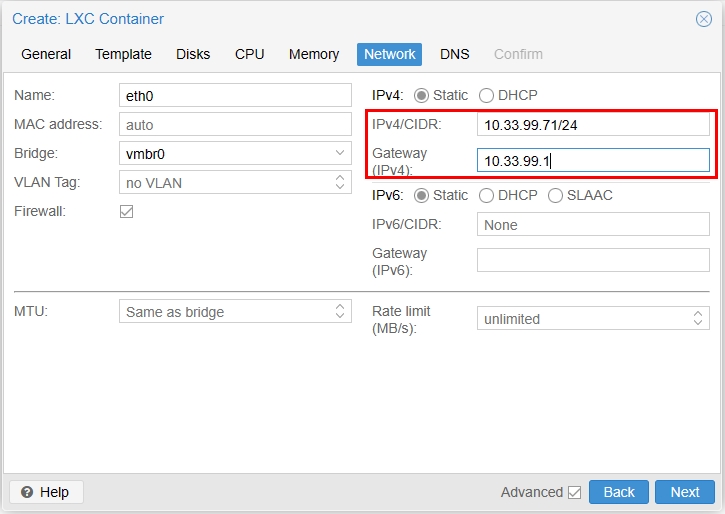
07. Left DNS settings at default.

08. Clicked 'Finish'.
Server Configurations
09. After going to the console and logging in as root, I ran the following command to update packages.
sudo apt-get update && sudo apt upgrade -y
apt-get update – updates the package lists for upgrades and new package installations. apt upgrade – will upgrade all currently installed packages. -y – will automatically answer ‘yes’ to any prompts. 10. Rebooted the server to finish the updates.
shutdown -r now
11. Next I added a user, because it's good practice to not use 'root'.
sudo adduser nesto
12. Then I added the user to the sudo group, that way they have sudo permissions to run commands.
sudo usermod -aG sudo nesto
13. Then I installed OpenSSH so I can remote in using MobaXterm (you can use Putty if you'd like)/
sudo apt install openssh-server
14. The SSH service will usually start after installing it, but I like to make sure by running the following command.
sudo systemctl start ssh
15. I won't go over how to do this, but I used MobaXterm to SSH into this Ubuntu server. Mainly because it's easier to copy and paste commands into the CLI.
Installing Docker
16. Running the following command will download the official GPG key for the Docker repository.
curl -fsSL https://download.docker.com/linux/ubuntu/gpg | sudo apt-key add -
-fsSL – Is a combination of flags: -f – tell ‘curl’ to not output anything if the HTTP status code indicates an error.. -s – tells ‘curl’ to hide the progress meter and error messages. -S – tells ‘curl’ to show error messages if it fails. -L – tells ‘curl’ to handle redirects.
17. Then I added the Docker repository with this command.
sudo add-apt-repository "deb [arch=amd64] https://download.docker.com/linux/ubuntu $(lsb_release -cs) stable"
deb – indicates that the repository is for binary packages. [arch=amd64] – means the repository is for 64-bit software. $(lsb_release -cs) – returns the codename for the Ubuntu server we installed and currently running commands on
stable tells the repository to use the latest stable version for Docker.
18. Updated packages again.
sudo apt-get update
19. Now I can install Docker Community Edition with the following command.
sudo apt-get install docker-ce -y
20. To test if Docker is installed correctly, I ran the following which will pull an image from the internet and output data to tell you if Docker is working.
sudo docker run hello-world
21. (Optional) Docker should start on it's own after installing, but you can double check by running the following command to start the service.
sudo systemctl start docker
22. Important: I wanted Docker to run upon startup, that way if there is a power outage, I won't have to manually start it.
sudo systemctl enable docker
23. I then added the user I created to the 'Docker' group, so that I have permission to run docker commands.
sudo usermod -aG docker ${USER}
Installing Docker-Compose
24. Now I downloaded Docker-Compose, and placed it in the '/usr/local/bin' directory.
sudo curl -L "https://github.com/docker/compose/releases/download/v2.7.0/docker-compose-$(uname -s)-$(uname -m)" -o /usr/local/bin/docker-compose
-L – Tells ‘curl’ to follow any redirects. $(uname -s) and $(uname -m) – are used to automatically fill in the system’s kernel name and machine hardware name (e.g. ‘Linux’ and ‘x86_64).
25. Then I made the Docker-Compose binary executable.
sudo chmod +x /usr/local/bin/docker-compose
26. You can check if the installation was successful by running the following command.
docker-compose --version
-
Grafana, Loki, Promtail Installation
Configuring YAML Files
27. I then created a directory for Grafana.
mkdir grafana
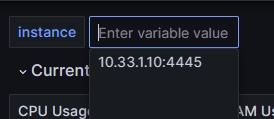
28. I then created a directory for Loki.
mkdir loki
29. Then a directory for Promtail
mkdir promtail
30. Then I created the yaml file.
nano docker-compose.yml
31. This will run all 3 docker containers.
					version: "3"
services:
  loki:
    image: grafana/loki:2.9.4
    volumes:
      - /home/nesto/loki:/etc/loki
    ports:
      - "3100:3100"
    restart: unless-stopped
    command: -config.file=/etc/loki/loki-config.yml
  promtail:
    image: grafana/promtail:2.9.4
    volumes:
      - /var/log:/var/log
      - /home/nesto/promtail:/etc/promtail
    restart: unless-stopped
    command: -config.file=/etc/promtail/promtail-config.yml
  grafana:
    image: grafana/grafana:latest
    user: "1000"
    volumes:
    - /home/nesto/grafana:/var/lib/grafana
    ports:
      - "3000:3000"
    restart: unless-stopped
ports: 3100:3100 – Maps port 3100 on the host to port 3100 on the container, you can change this if you’re already using port 3100 elsewhere.
I also changed the image from loki:latest, and promtail:latest because the containers kept getting stuck in a restart loop. After quite of bit of troubleshooting I found specifying the 2.9.4 version fixed it.
32. Then I created another yaml file within the Loki directory I created earlier.
nano loki/loki-config.yml
33. I left everything at default.
					auth_enabled: false

server:
  http_listen_port: 3100
  grpc_listen_port: 9096

common:
  path_prefix: /tmp/loki
  storage:
    filesystem:
      chunks_directory: /tmp/loki/chunks
      rules_directory: /tmp/loki/rules
  replication_factor: 1
  ring:
    instance_addr: 127.0.0.1
    kvstore:
      store: inmemory

schema_config:
  configs:
    - from: 2020-10-24
      store: boltdb-shipper
      object_store: filesystem
      schema: v11
      index:
        prefix: index_
        period: 24h

ruler:
  alertmanager_url: http://localhost:9093
34. Next I created the Promtail yaml file.
nano promtail/promtail-config.yml
35. I kept all the default settings as well.
					server:
  http_listen_port: 9080
  grpc_listen_port: 0

positions:
  filename: /tmp/positions.yaml

clients:
  - url: http://loki:3100/loki/api/v1/push

scrape_configs:

# local machine logs

- job_name: local
  static_configs:
  - targets:
      - localhost
    labels:
      job: varlogs
      __path__: /var/log/*log
36. Then I started all of them up with the following command. You want to make sure nothing is stuck in a restart loop.
docker-compose up -d
37. It'll take some time to install. You can always check if everything is running correctly by running the following command.
sudo docker ps
Accessing Grafana
38. First I waited for Promtail to be ready. To check if Promtail is ready, you'll access your server's IP with the port 3100/ready (example: 10.33.99.71:3100/ready). If it doesn't return with the word 'ready' then keep refreshing every few seconds until it does.
39. Then I access Grafana by adding port 3000/login (example: 10.33.99.71:3000/login). The default login is admin:admin.
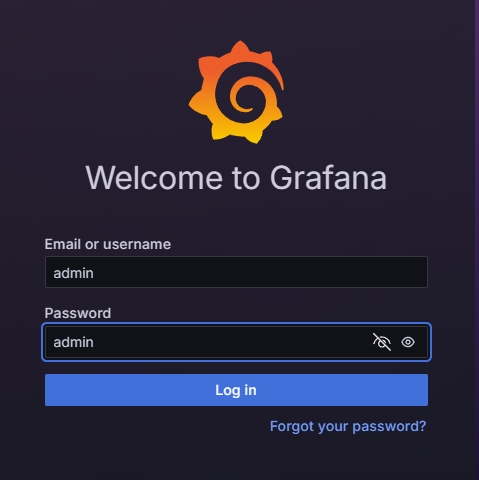
40. You can change the password on the following screen. Afterwards, I started on setting up Prometheus.

-
Prometheus LXC Configuration
Server Configuration
41. I setup another container, this one specifically for Prometheus. I followed the same steps as I showed earlier, with minor changes.
Also, install Docker and Docker-Compose.
Configuring YAML File
42. First, I made a Prometheus directory.
mkdir prometheus
43. Then I made the docker-compose file.
nano /prometheus/docker-compose.yml
44. The only thing I changed were the file paths.
					version: '3.3'
services:
    node-exporter:
        network_mode: host
        pid: host
        volumes:
            - '/:/host:ro,rslave'
        image: 'quay.io/prometheus/node-exporter:latest'

    prometheus:
        container_name: prometheus
        ports:
            - '9091:9090' #modify 9091 to your setup needs
        volumes:
            - '/home/nesto/prometheus/prometheus.yml:/etc/prometheus/prometheus.yml' #modify the path for your install location
        image: prom/prometheus
45. Then I also created another yaml file.
nano /prometheus/prometheus.yml
46. You'll need to change the IP addresses to match the IP address you set for this server. The file is important to remember since we'll be editing it again.
					global:
  scrape_interval: 5s
  external_labels:
    monitor: 'node'
scrape_configs:
  - job_name: 'prometheus'
    static_configs:
      - targets: ['192.168.68.127:9090'] ## IP Address of the localhost. Match the port to your container port
  - job_name: 'node-exporter'
    static_configs:
      - targets: ['192.168.68.127:9100'] ## IP Address of the localhost
47. Then I started the docker container.
sudo docker-compose up -d
48. You can visit the webui by going to the IP plus port 9091 (example: 10.33.1.26:9091). But the configuration will be done on the prometheus.yml file I created earlier.
-
OhmGraphite Setup
Installation
49. I installed OhmGraphite on the computers I wanted to monitor.
First, I downloaded the installation zip file from here ( https://github.com/nickbabcock/OhmGraphite/releases/tag/v0.32.0) and extracted the files.
50. Then open the file 'OhmGraphite.exe.config' with Notepad.
51. Make sure you match the port number, and for prometheus_host will be the IP address of the computer you want to monitor. Then save the file.
					<?xml version="1.0" encoding="utf-8" ?>
<configuration>
  <appSettings>
    <add key="type" value="prometheus" />
    <add key="prometheus_port" value="4445" />

    <!-- This is the host that OhmGraphite listens on.
         `*` means that it will listen on all interfaces.
         Consider restricting to a given IP address -->
    <add key="prometheus_host" value="10.33.1.10" />
    <add key="prometheus_path" value="metrics/" />
  </appSettings>
</configuration>
52. Next I opened command prompt with admin privileges and changed directory to the folder that has the extracted files.
From there I ran the following command to install it.
.\OhmGraphite.exe install
53. Then started it up.
.\OhmGraphite.exe start
Linking to Prometheus
54. I then logged back into my Prometheus server, and then edited the prometheus.yml file.
I then added the 3 lines starting with 'job_name: 'ohmgraphite'.
					global:
  scrape_interval: 5s
  external_labels:
    monitor: 'node'
scrape_configs:
  - job_name: 'prometheus'
    static_configs:
      - targets: ['10.33.1.26:9091'] ## IP Address of the localhost. Match the port to your container port
  - job_name: 'node-exporter'
    static_configs:
      - targets: ['10.33.1.26:9100'] ## IP Address of the localhost
  - job_name: 'ohmgraphite'
    static_configs:
      - targets: ['10.33.1.10:4445']
-
Grafana Dashboard
Finish Setup
55. I logged back into Grafana and went to Connections > Data Sources.
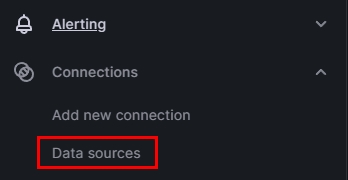
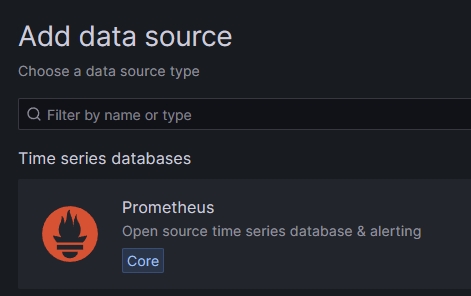
56. Then clicked Add New Data source and selected Prometheus.
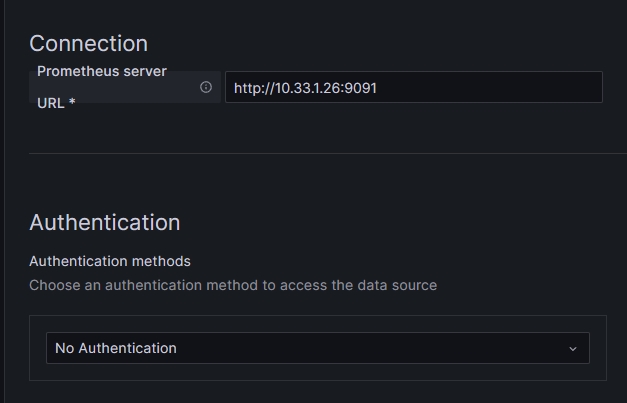
57. Enter the IP for the server, and change Authentication to 'No Authentication'. Then clicked Save & Test.
58. I then grabbed the following dashboard ID (https://grafana.com/grafana/dashboards/11587-ohm-windows-desktop/).
59. Then I went to import a new dashboard.
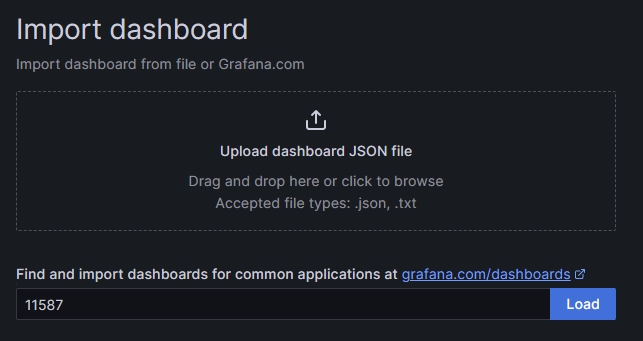
60. I left the defaults and clicked Import.
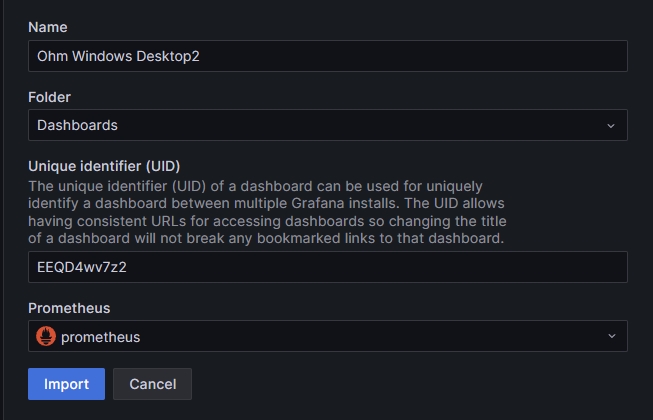
61. Then opened the dashboard and select the IP of the computer I want to see metrics.
